Globally, four out of five children of lower secondary school age are enrolled in school
Many countries have committed themselves to more than the achievement of universal primary education and now include several years of secondary school in their national targets. Globally, 83 per cent of lower secondary-school-age children are in either primary or secondary school, dropping to less than 70 per cent in low-income countries. From 2000 to 2013, the number of out-of-school children of lower secondary school age shrank from 97 million to 65 million. But progress has slowed since 2007. Challenges to secondary-school participation are greatest in sub-Saharan Africa and South Asia..
The barriers to school attendance at the secondary level are similar to those at the primary level, but are intensified. The cost of secondary schooling is often higher and more difficult for families to afford; secondary schools tend to be farther from home, often requiring transportation; and the pressure to earn an income keeps many adolescents out of the classroom.
As a result, secondary education is still reserved for a privileged fraction of the population in many countries. In the majority of countries in sub-Saharan Africa, for example, less than half of secondary-school-age adolescents are enrolled in secondary school, leaving millions of young people entering the workforce without the necessary academic and life skills. In Angola, the Central African Republic and Niger, more than 80 per cent of adolescents of the appropriate age are not enrolled in secondary school.
Few countries worldwide have achieved universal secondary education
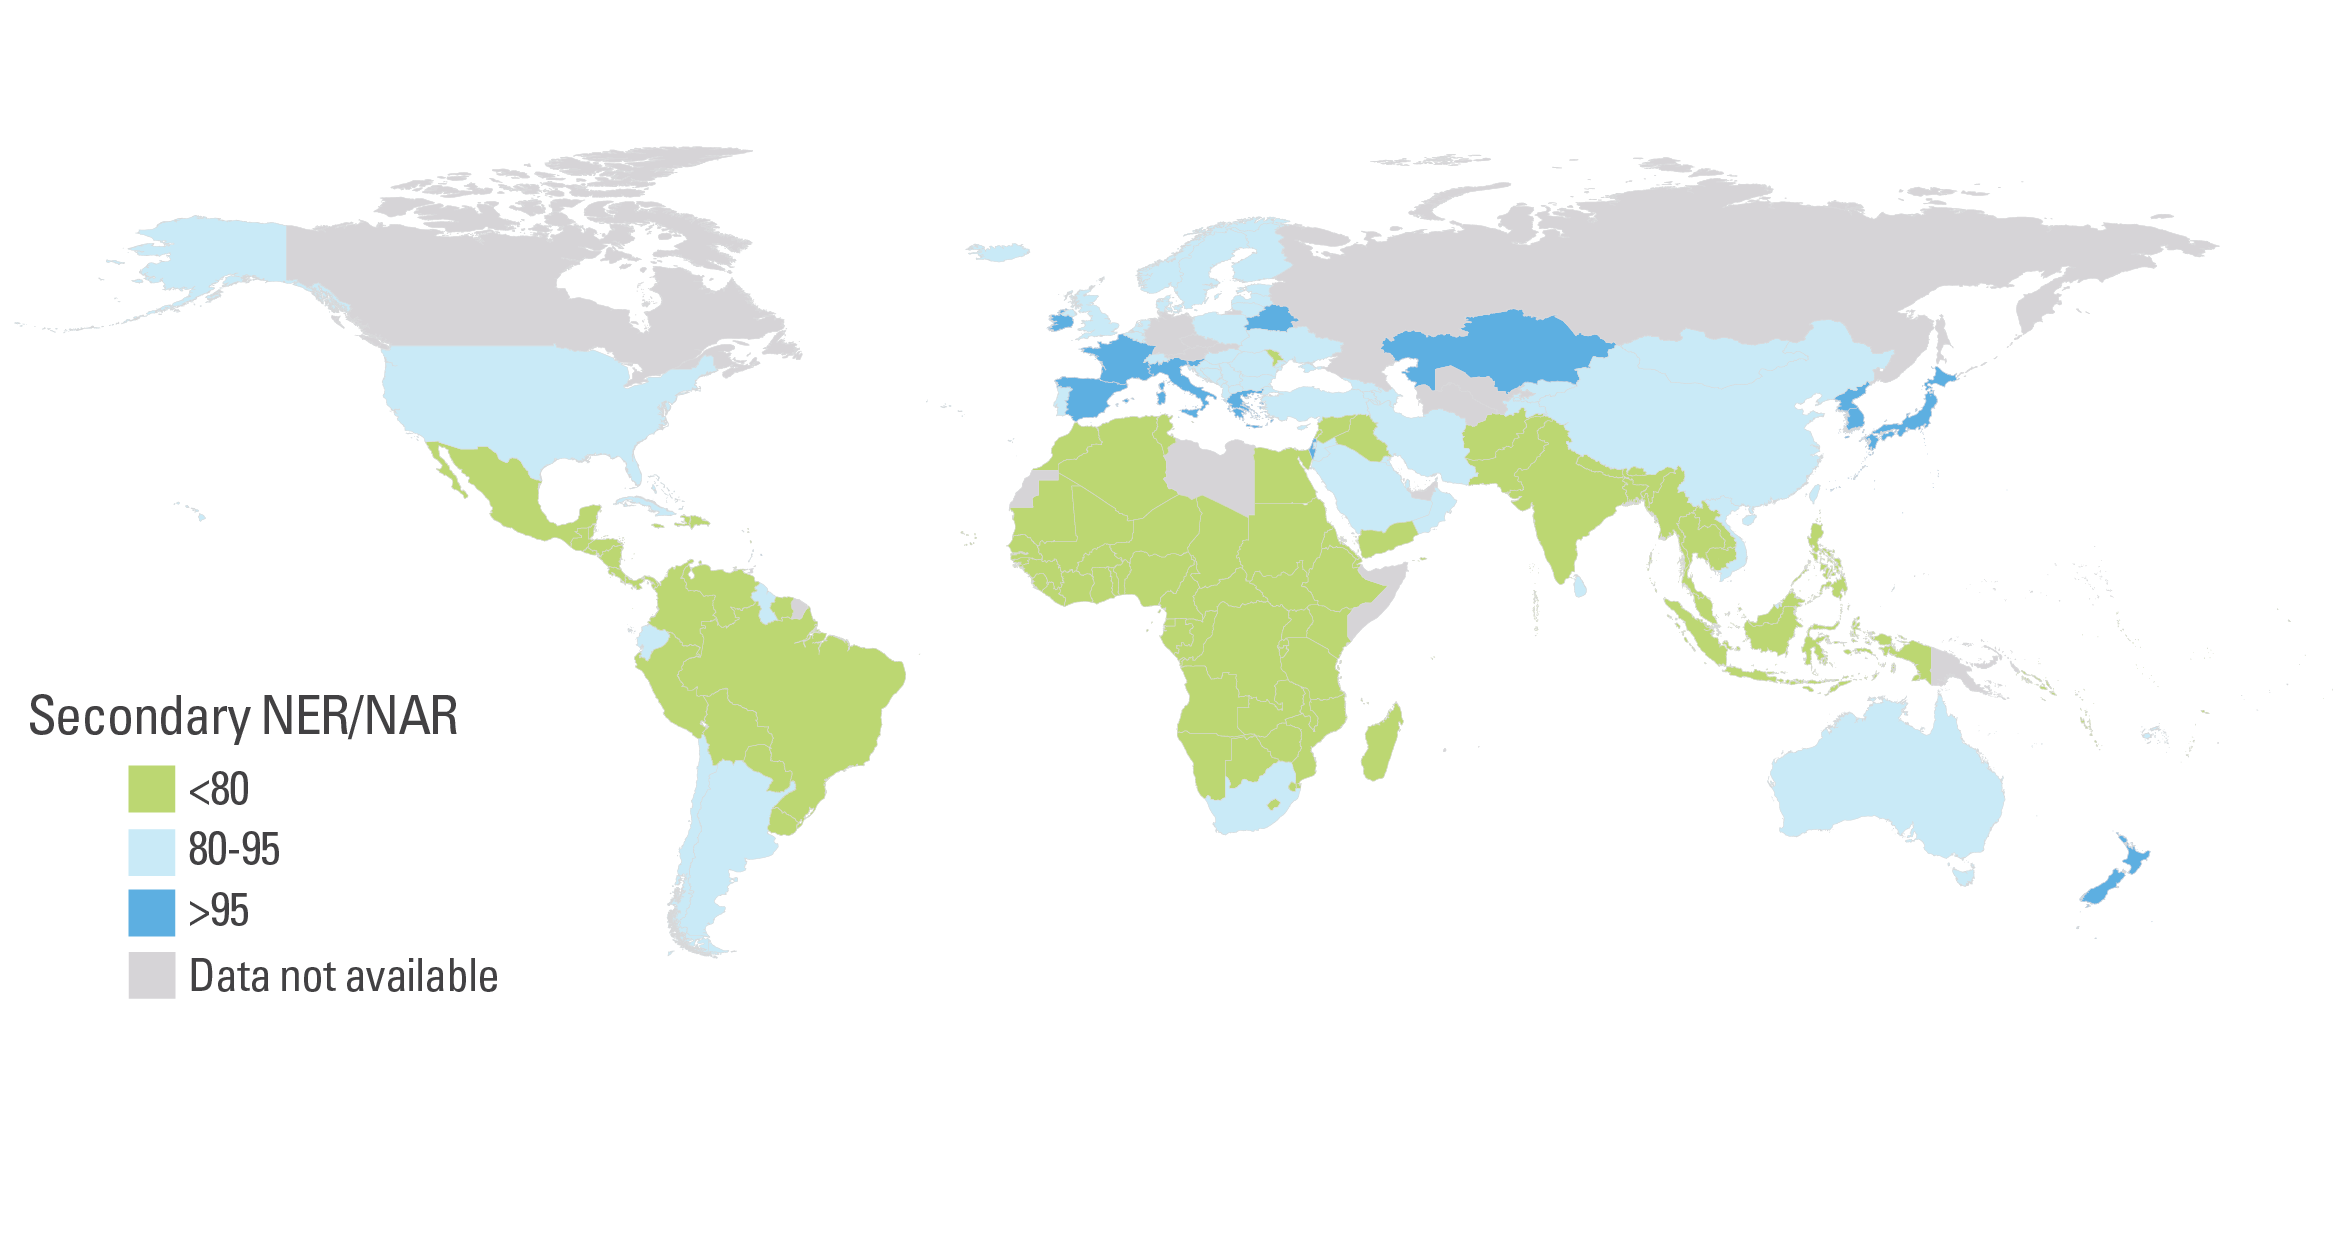
Notes: Net enrolment data are prioritized. Net attendance data from surveys were used when net enrolment data were not available.
Source: UNESCO Institute for Statistics global databases, 2016, based on administrative data for the most recent year available during the period 2009–2014. UNICEF global databases, 2016, based on MICS, DHS and other nationally representative surveys, 2009–2014.
CHILDREN OUT OF SCHOOL
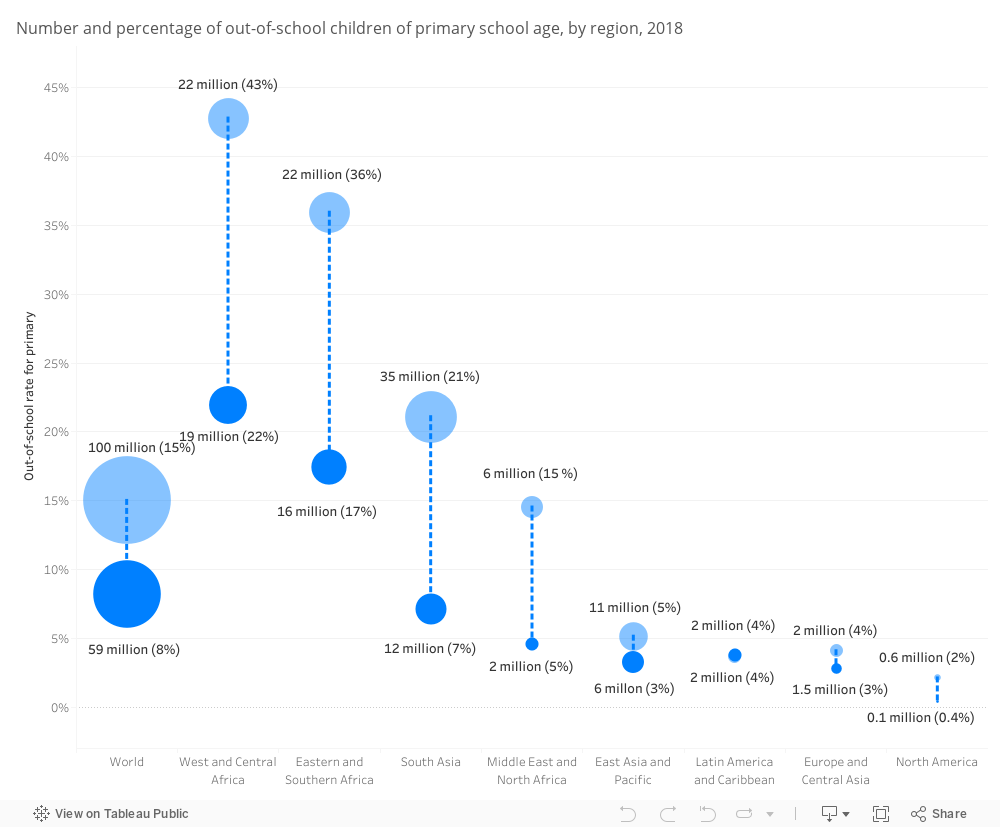
When children of lower secondary school age are added to those of primary school age, the number of children out of school globally doubles – to more than 120 million. About half of them (51 percent) are girls.
In 2013, an estimated 65 million children of lower secondary school age were out of school. More than a three quarter of them were concentrated in South Asia and sub-Saharan Africa. In West and Central Africa, about 40 per cent of lower secondary-school-age children are not in school. In Niger, the out-of-school rate is 78 per cent, and in India 16 million children of lower secondary school age are out of school.
In many countries, poorer children are far less likely to go to school than their wealthier peers
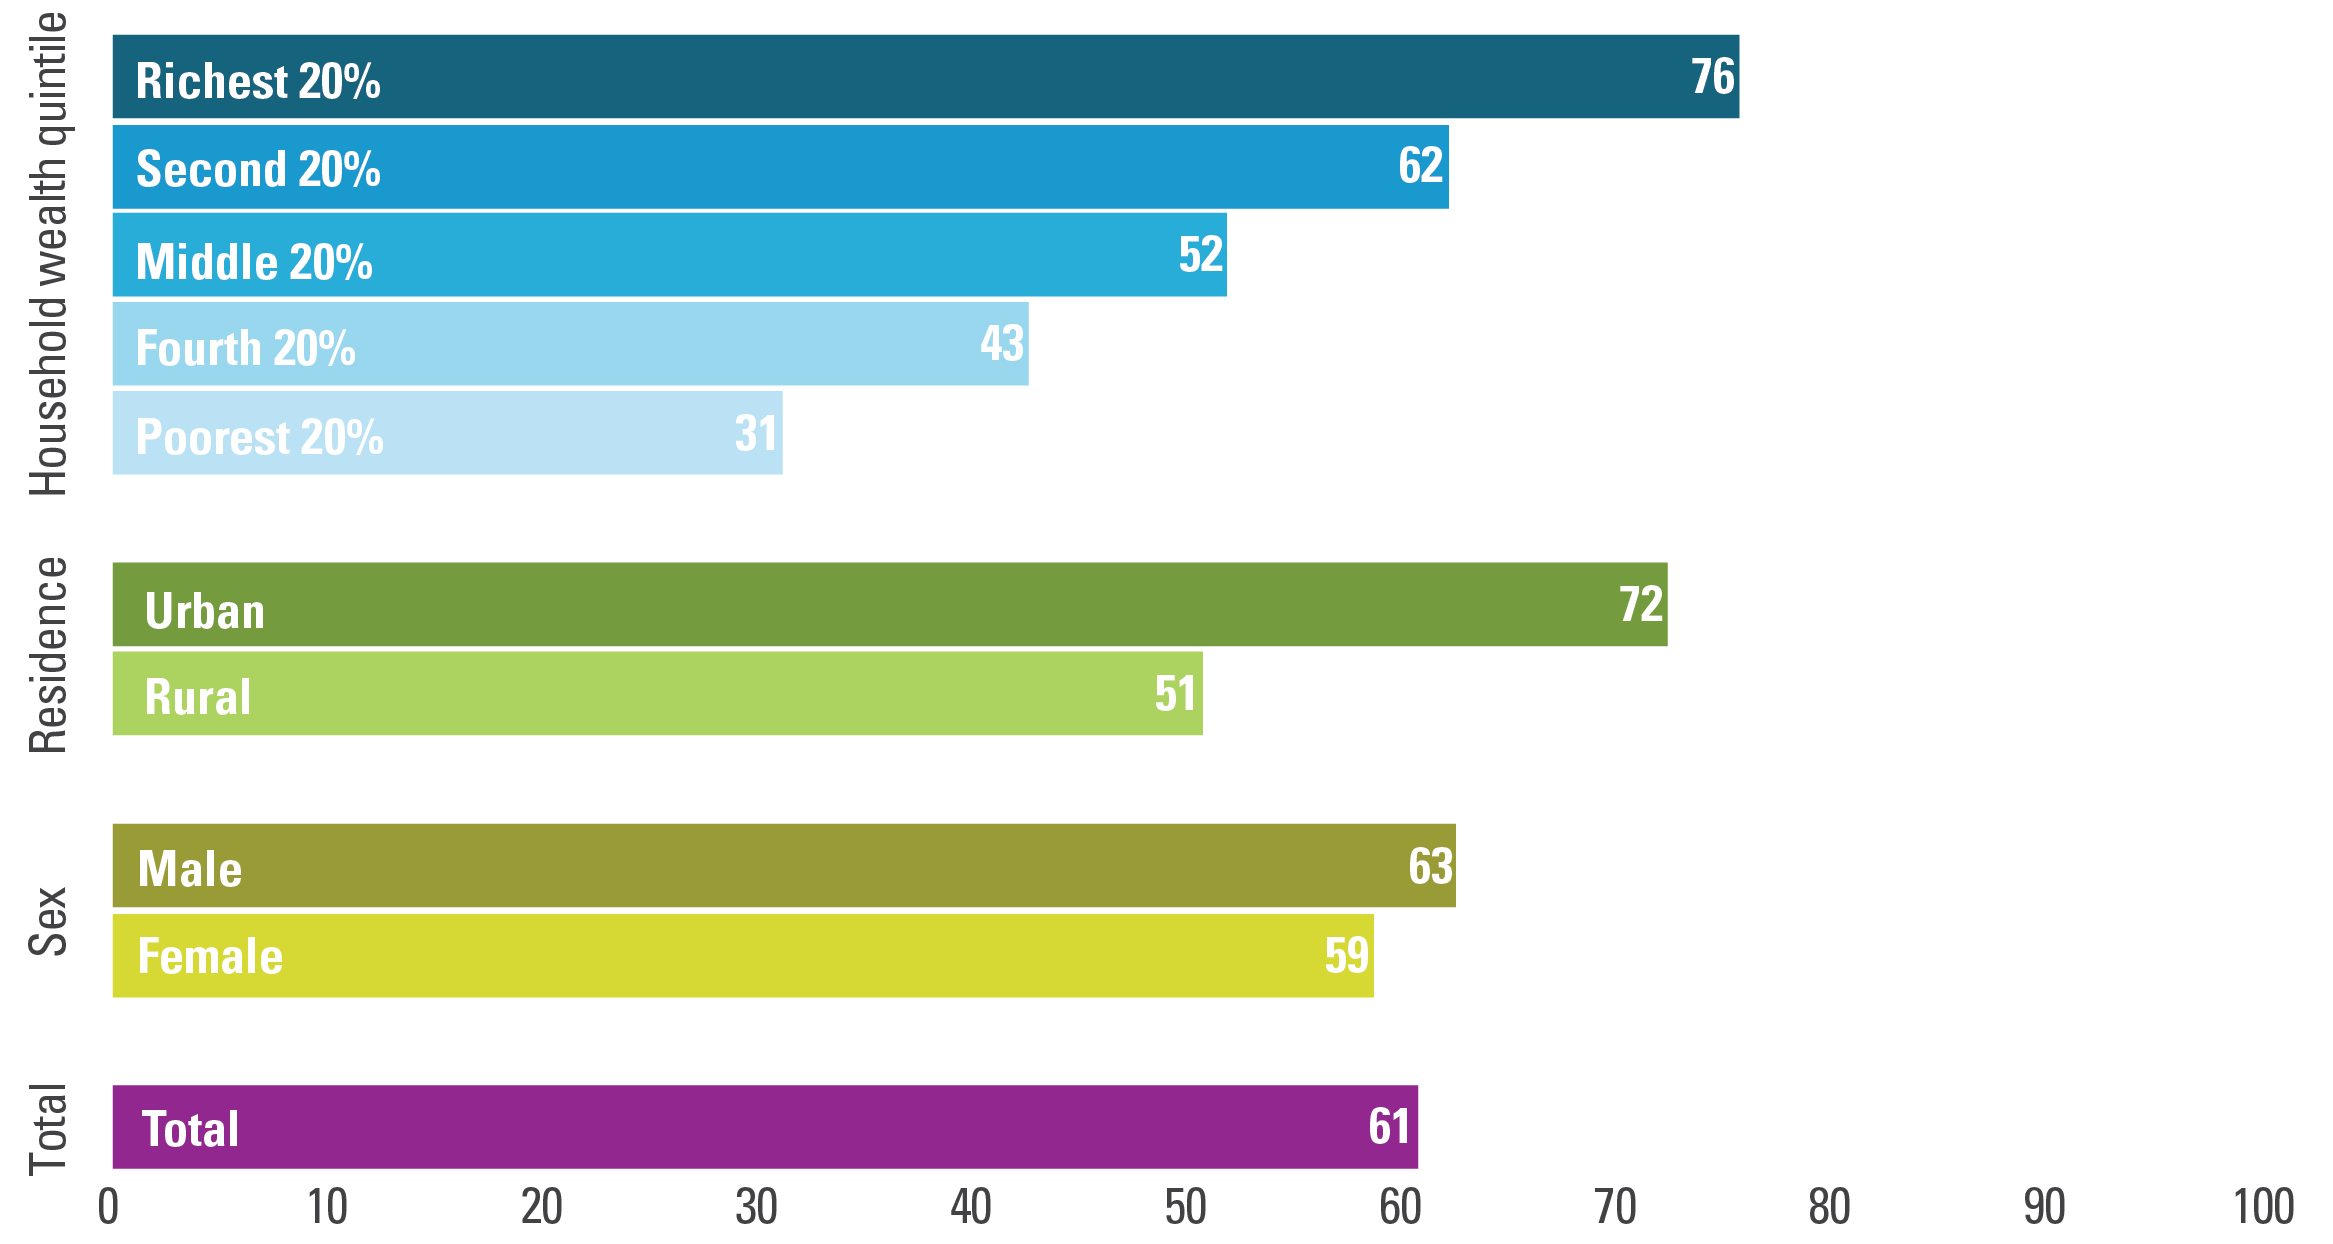
Notes: Calculation is based on most recent household surveys conducted during the period 2009-2014 with the exceptions of 2005-06 data from India. The average was calculated based on weighted net attendance rates. Secondary school age populations were used as the weights.
Source: UNICEF global databases, 2016
GENDER EQUALITY
While more than two thirds of countries and areas have reached gender parity in primary education, less than half of them have achieved parity at the secondary level. The largest gender gaps are observed in West and Central Africa, where 79 girls are enrolled in secondary school for every 100 boys. In Chad, girls’ enrolment is less than half that of boys. In contrast, in Latin America and the Caribbean, more girls than boys are enrolled in secondary school.
In sub-Saharan Africa and South Asia, more than a quarter of lower secondary-school-age children are out of school
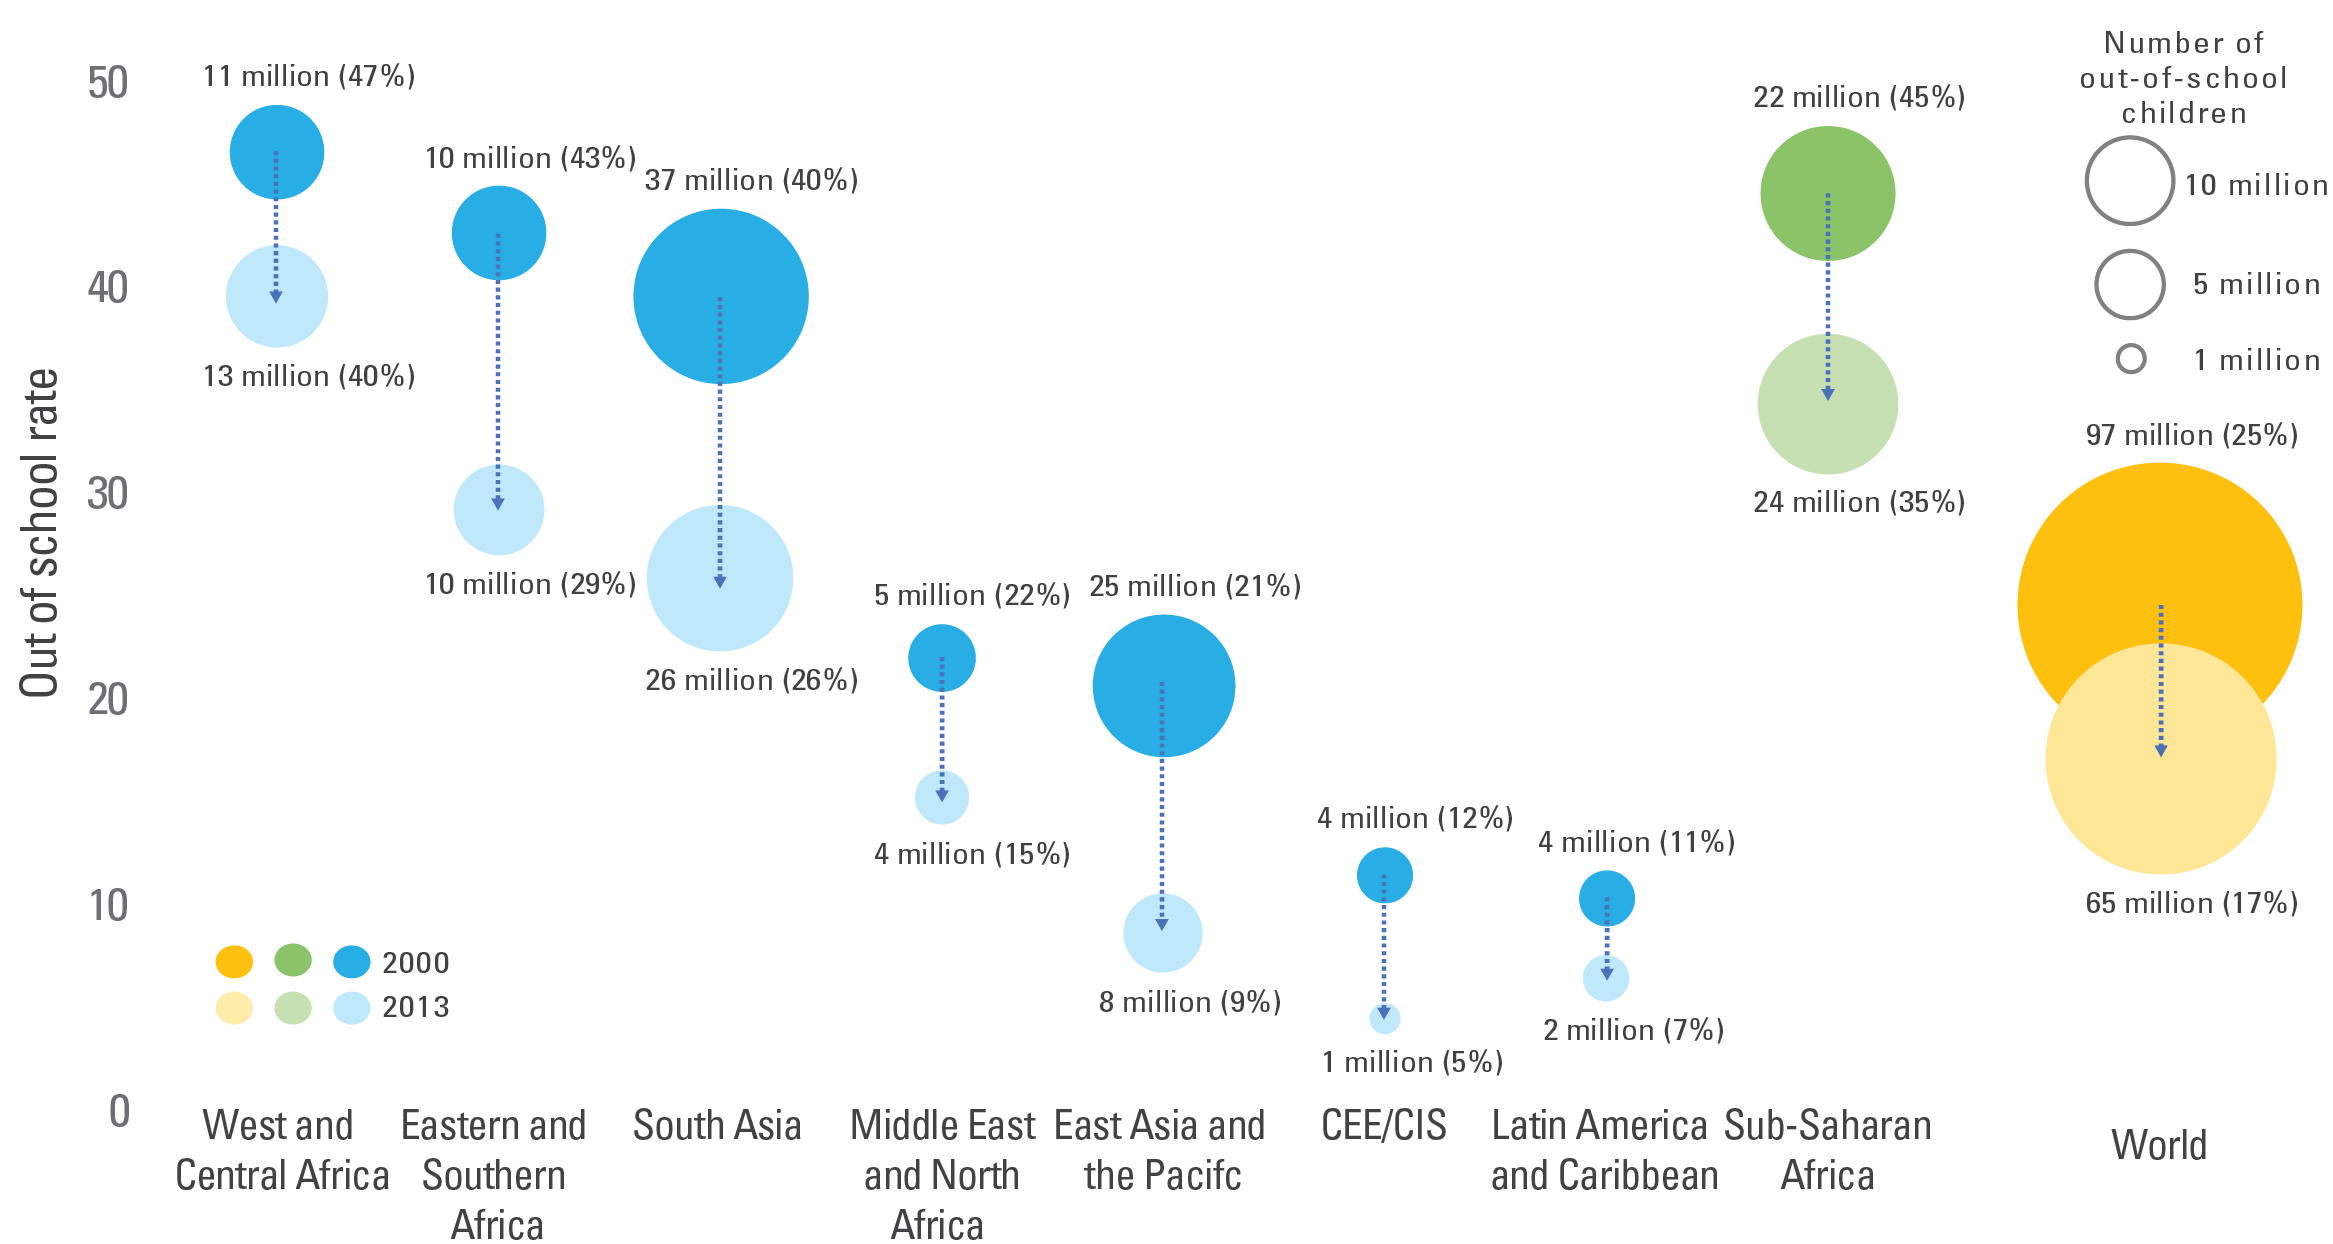
* CEE/CIS: Central and Eastern Europe and the Commonwealth of Independent States
Source: UNESCO Institute for Statistics global databases, 2016
LEARNING
Although more children are attending secondary school, many face serious learning difficulties. In 2012, the results of the Programme for International Student Assessment, known as PISA, indicated that large numbers of 15-year-old students struggle to master basic reading and numeracy skills in UNICEF-supported countries. In the majority of these countries, more than half of the students assessed failed to reach the minimum level of performance in mathematics. Most countries show some improvement since the 2009 assessment, but learning levels remain low.
The gender gap in secondary education is widest in West and Central Africa
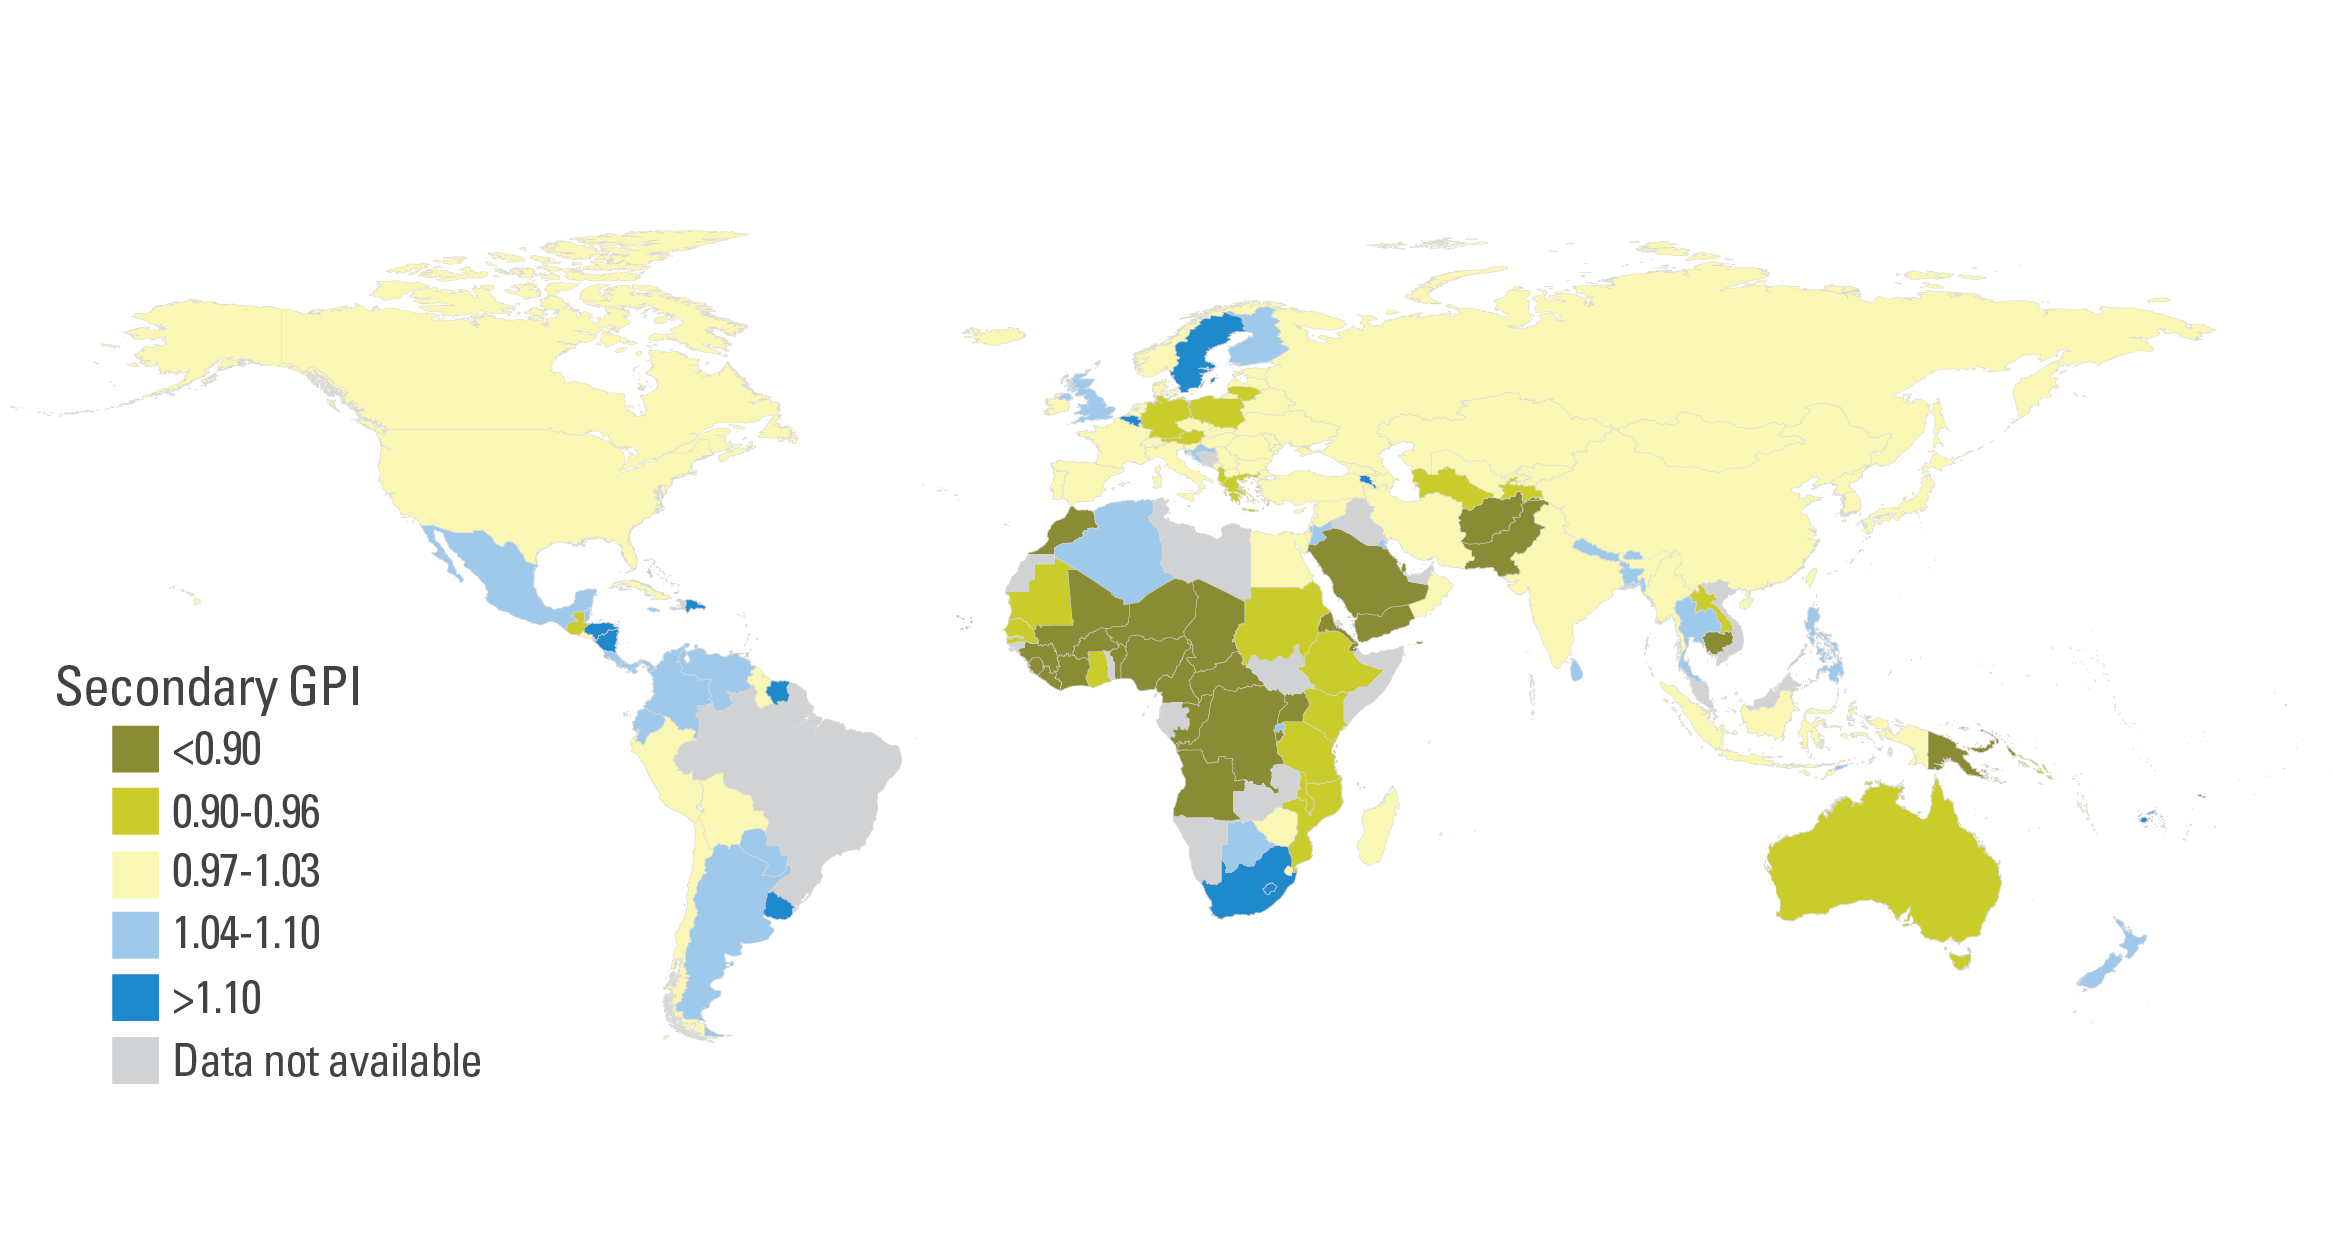
Source: UNESCO Institute for Statistics global databases, 2016, based on administrative data for the most recent year available during the period 2009–2015
In the majority of countries that participated in the 2012 assessment, boys performed better than girls in mathematics. In some countries, such as Chile, Colombia and Costa Rica, the gap was larger than 10 percentage points in favour of boys.
An international assessment programme shows that most 15-year-old students failed to achieve even a minimum proficiency in mathematics
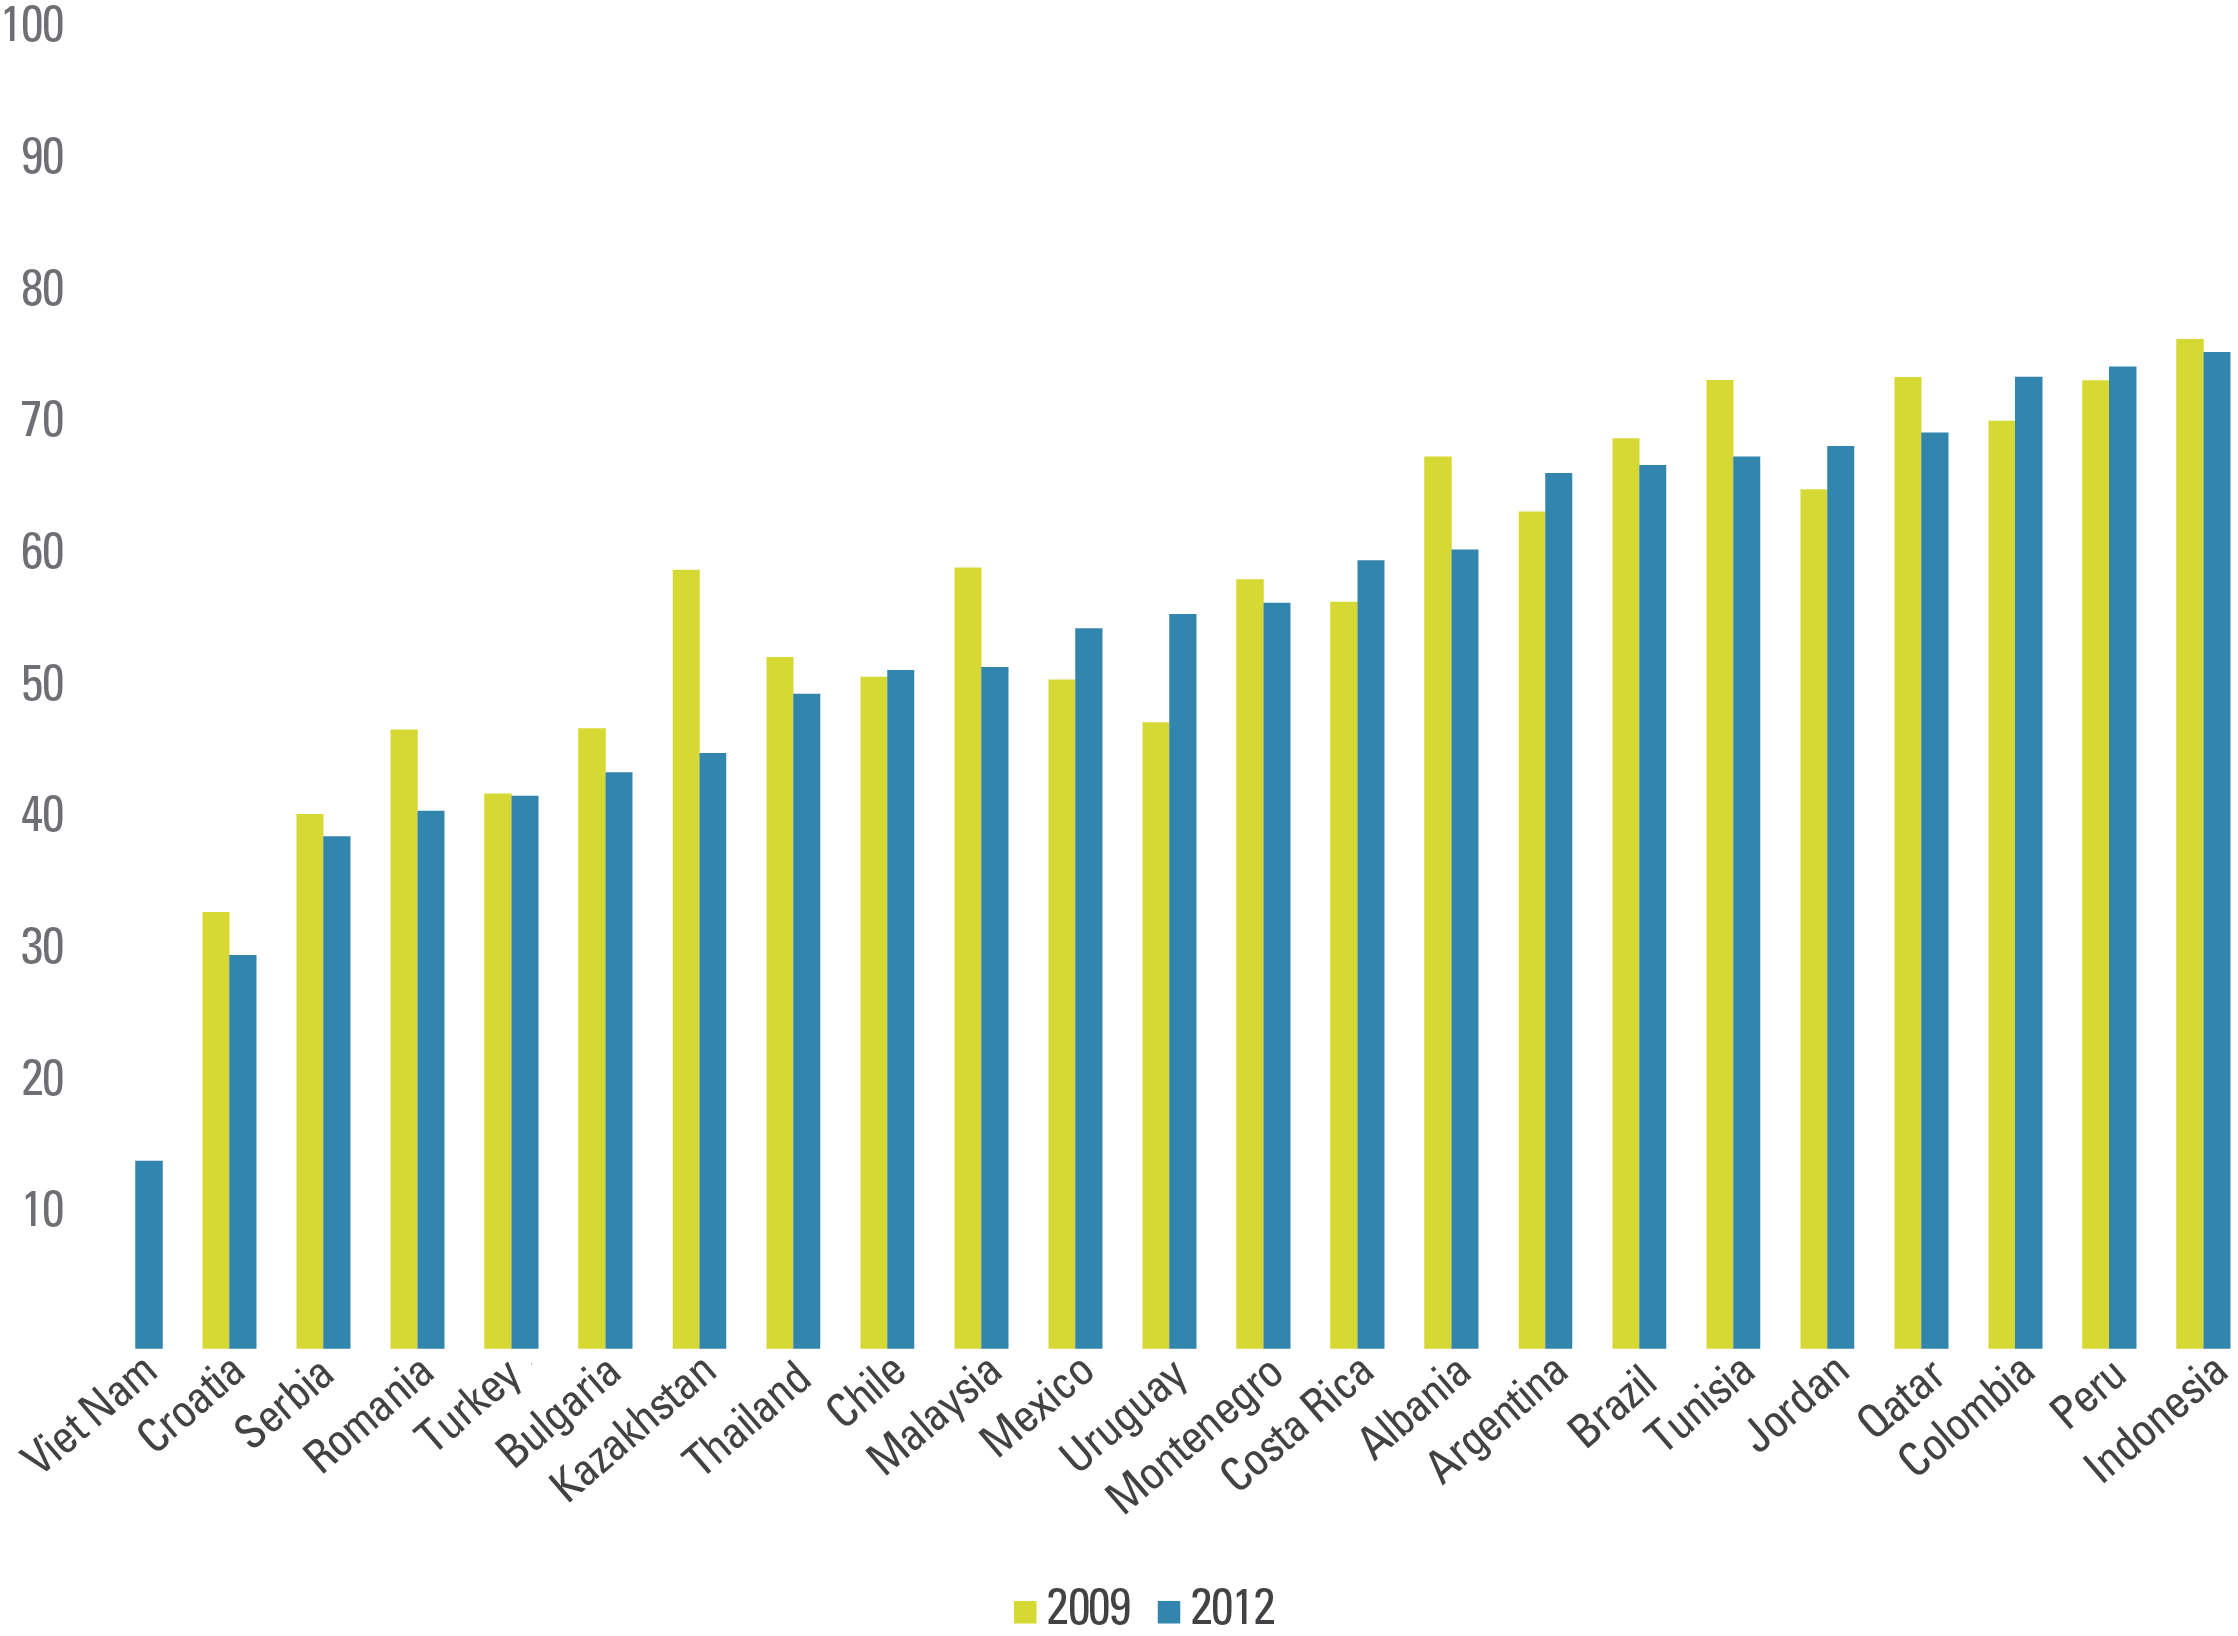
Source: Organisation for Economic Co-operation and Development global databases, 2014.
Notes on the Data
For a full picture of children’s school participation, UNICEF uses two sources of data: enrolment data, which are based on administrative records, and attendance data from household surveys. In half of all countries, data on primary and secondary education come from more than one source. All data on primary and secondary education used by UNICEF are based on official International Standard Classifications of Education (ISCED) and may deviate somewhat from those used by country-specific school systems.
DEFINITION OF INDICATORS
Gender parity index – The ratio of female-to-male values of a given indicator. A GPI of 1 indicates parity between the sexes.
Literacy rate – Total number of literate persons in a given age group, expressed as a percentage of the total population in that age group. The adult literacy rate measures literacy among persons aged 15 years and older, and the youth literacy rate measures literacy among persons aged 15 to 24 years.
Out-of-school population –Total number of primary, lower secondary or upper secondary school-age children who are not enrolled in preprimary (ISCED 02) , primary (ISCED 1), secondary (ISCED 2 or 3), post-secondary or higher education (ISCED 4-6).
Pre-primary school gross enrolment ratio – Number of children enrolled in pre-primary school, regardless of age, expressed as a percentage of the total number of children of official pre-primary school age.
Primary school gross enrolment ratio – Number of children enrolled in primary school, regardless of age, expressed as a percentage of the total number of children of official primary school age.
Primary school net attendance ratio – Number of children attending primary or secondary school who are of official primary school age, expressed as a percentage of the total number of children of official primary school age. Because of the inclusion of primary-school-age children attending secondary school, this indicator can also be referred to as a primary adjusted net attendance ratio.
Primary school net enrolment ratio – Number of children enrolled in primary or secondary school who are of official primary school age, expressed as a percentage of the total number of children of official primary school age. Because of the inclusion of primary-school-age children enrolled in secondary school, this indicator can also be referred to as a primary adjusted net enrolment ratio.
Secondary school net attendance ratio – Number of children attending secondary or tertiary school who are of official secondary school age, expressed as a percentage of the total number of children of official secondary school age. Because of the inclusion of secondary-school-age children attending tertiary school, this indicator can also be referred to as a secondary adjusted net attendance ratio.
Secondary school net enrolment ratio – Number of children enrolled in secondary school who are of official secondary school age, expressed as a percentage of the total number of children of official secondary school age. Secondary net enrolment ratio does not include secondary-school-age children enrolled in tertiary education, owing to challenges in age reporting and recording at that level.
Survival rate to last primary grade – Percentage of children entering the first grade of primary school who eventually reach the last grade of primary school.
REFERENCES
- UNESCO, Education for All Global Monitoring Report 2013/14: Teaching and Learning – Achieving Quality for All, UNESCO, Paris, 2014.
- UNESCO Institute for Statistics, global databases, 2014.
- UNESCO Institute for Statistics, Global Education Digest 2012, Opportunities Lost: The impact of grade repetition and early school leaving, UIS, Montreal, 2012.
- UNICEF, The State of the World’s Children 2015: Reimagine the Future – Innovation for Every Child, UNICEF, New York, 2014.