Secondary education
The education and training that children receive in secondary school equip them with skills that are necessary to fully participate in society. Though the duration in each country vary, secondary education typically covers ages 12 to 17 and is divided into two levels: lower secondary education (spanning 3 to 4 years) and upper secondary education (spanning 2 to 3 years). However, in 2021, just two in three children of lower secondary school age attended either lower or upper secondary school, and only one in two children of upper secondary school age attended either upper secondary school or higher education. From 2000 to 2020, the number of out-of-school children of lower secondary school-age shrank from 98 million to 63 million, and the number of out-of-school children of upper secondary school-age fell from 175 million to 132 million. Although notable progress has been made in the past few decades, challenges remain in reducing regional disparities and inequalities among secondary school-age students from different socioeconomic backgrounds.
Inequalities in access to secondary education increase as children get older
In 2021, the global adjusted net attendance rates for lower and upper secondary education were 65 per cent and 52 per cent, respectively. Children from urban areas and the wealthiest households have much higher attendance rates in both lower and upper secondary education, with the gap growing wider at the upper secondary level.
Worldwide, roughly 70 per cent of children complete lower secondary education. However, only 43 per cent of children from the poorest wealth quintile in their country do so, compared to 85 per cent of children from the richest wealth quintile. Across different regions, household wealth impacts lower secondary education completion rates differently.
Many children of secondary education age are out of school, particularly in Africa
The total number of secondary school-age children who are out of school has decreased by nearly 30 per cent since 2000. However, in 2020, there were still over 195 million children of secondary school age who were out of school. More boys than girls were out of school, and progress in reducing the number of out-of-school children of secondary school age has slowed significantly since 2010.
Although in the past two decades, the total number of out-of-school children of secondary school reduced by almost 30 per cent, dropping from 274 million in 2000 to 195 million in 2020, the progress has stalled for the past decade. In addition, startling differences by region and socioeconomic background exist. Globally, 13 per cent of lower secondary school-age children are out of school, with a 21-percentage point gap between the children from the richest and the poorest households. Disparity by wealth is most acute in West and Central Africa, where the gap reaches 44 percentage points.
More girls are accessing upper-secondary education than ever before
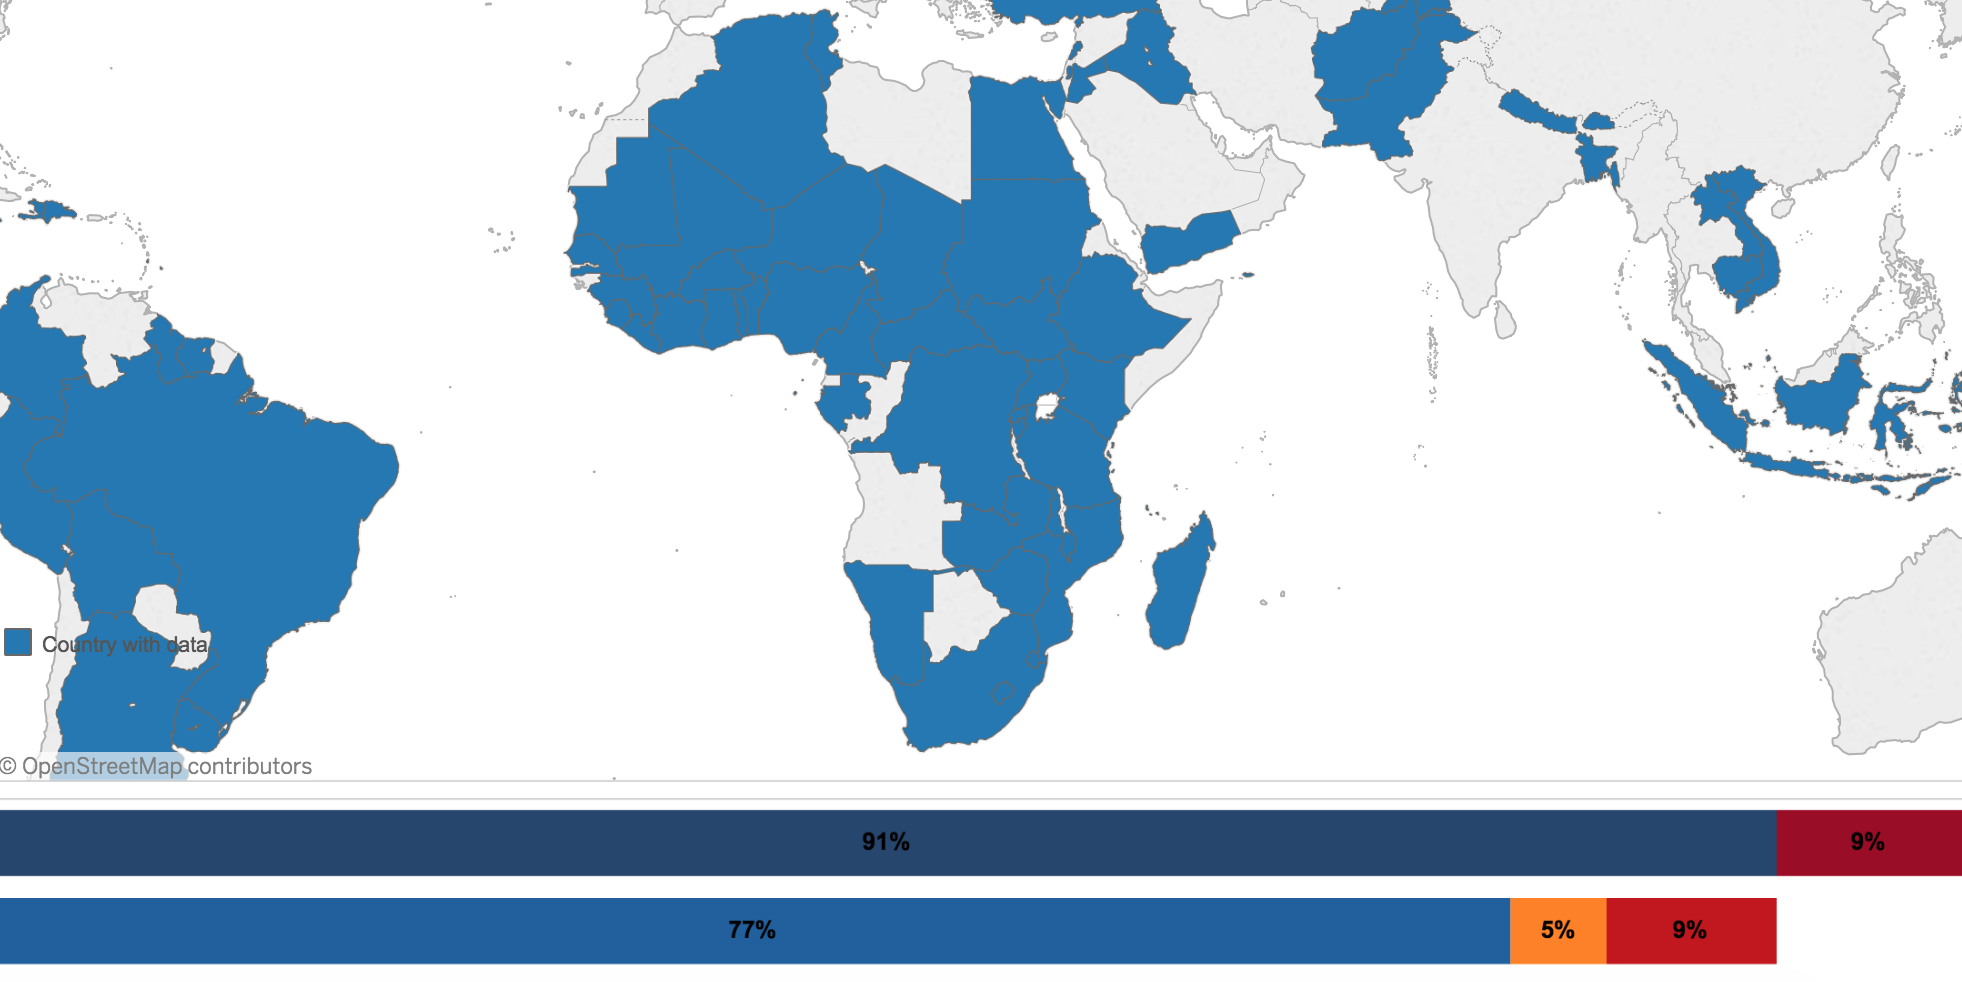
As measured by adjusted net attendance rates at the upper secondary level, 64 out of 109 countries with data available have a gender parity index over 1.03, meaning that in these countries, gender disparities in upper secondary attendance disadvantage boys. This could be mainly due to gender norms that drive boys to drop out to work and, in some contexts, may also be due to recruitment into illicit groups. For countries with gender parity index lower than 0.97 (girl disadvantage), two-thirds of them are in Eastern and Southern Africa or West and Central Africa. The gender gap in upper secondary attendance indicates that there is ample room for improvement to help every boy and girl to access education to thrive.
Results from the OECD’s Programme for International Student Assessment (PISA) are often used to measure learning among lower secondary students. 2018 PISA results for reading show that in every participating country, girls outperformed boys, as the proportion of girls achieving a minimum level of proficiency is higher than that of boys. However, girls continue to be under-represented among top performers in science and math, indicating that boys in OECD countries receive more support and encouragement to perform and achieve academically.
Secondary education data
Build and download your own customisable dataset
Resources


Notes on the data
For a full picture of children’s school participation, UNICEF uses two sources of data: enrolment data, which are based on administrative records, and attendance data from household surveys. In half of all countries, data on primary and secondary education come from more than one source. All data on primary and secondary education used by UNICEF are based on official International Standard Classifications of Education (ISCED) and may deviate somewhat from those used by country-specific school systems.
Definition of indicators
Lower secondary education adjusted net attendance rate – Percentage of children of lower secondary school age who attend secondary or higher education.
Upper secondary education adjusted net attendance rate – Percentage of children of upper secondary school age who attend upper secondary or higher education.
Lower secondary education completion rate – Total number of children who are 3 to 5 years older than the intended age for the last grade of lower secondary education who completed lower secondary education, expressed as a percentage of the total number of children who are 3 to 5 years older than the intended age for the last grade of lower secondary education.
Upper secondary education completion rate – Total number of children who are 3 to 5 years older than the intended age for the last grade of upper secondary education who completed upper secondary education, expressed as a percentage of the total number of children who are 3 to 5 years older than the intended age for the last grade of upper secondary education.
Lower secondary education out-of-school children rate – Total number of children of lower secondary school age and who are not enrolled in primary or secondary education.
Upper secondary education out-of-school children rate – Total number of children of upper secondary school age and who are not enrolled in primary education, secondary, or higher education.
Gender parity index – The ratio of female-to-male values of a given indicator. Normally, a GPI between 0.97 and 1.03 indicates parity between the sexes, whereas a GPI lower than 0.97 indicates girl disadvantage and a GPI greater than 1.03 indicates boy disadvantage.